
About the course
The Excel 2016 - Expert - Advanced Charting and Data Analysis course covers topics included in the MOS Expert exam 77-728. This includes using Advanced Chart features, PivotTables, Cube Functions and PivotCharts. You will also learn how to create Scenarios, Data Tables and use Goal Seek.
Modules
There are 7 modules in this course
- Trendlines and Sparklines
- Dual Axes and Chart Templates
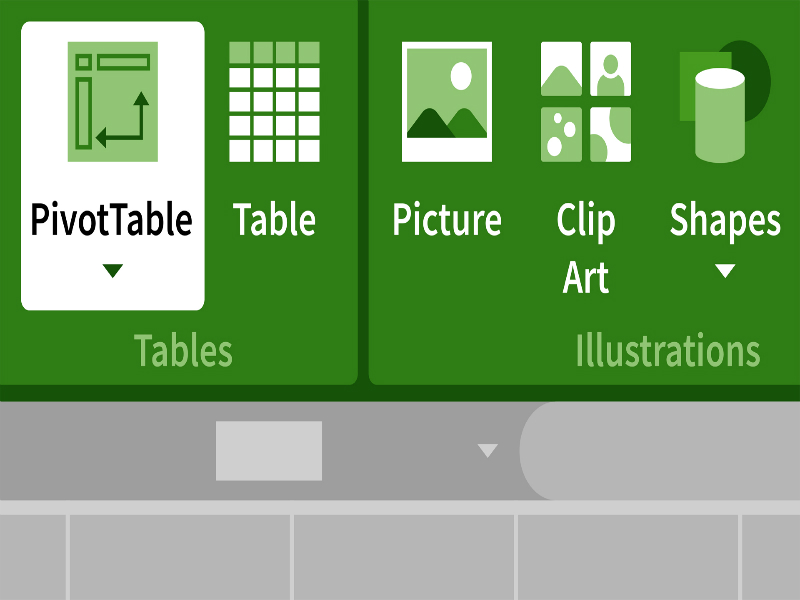
- PivotTables
- Cubes and PivotTables
- PivotCharts
- Slicers
- Data Analysis Tools
Course features
- Simulation training replicates the software you are learning providing a realistic learning experience.
- Learn how to perform tasks at your own pace and interactively by following easy step-by-step actions.
- Reinforce your knowledge at the end of each lesson by completing interactive and multiple choice quiz questions.
- Assess your skills at any time by undertaking the Course Test.
- Lessons can be completed within 30 minutes so training can be undertaken in ?bite? size pieces.
- Bookmarking allows you to learn in multiple training sessions.
- Course navigation features allow you to jump directly to specific topics of interest quickly and easily.
- Designed for people who require initial and refresher training activities.
- Available on-line 24 hours a day.
- Version for Mobile Devices.
- Review course content with eBooks
Youll learn how to:
Advanced Chart Features - Trendlines and Sparklines
- Understand Trendlines;
- Add a Trendline to a Data Series;
- Format Trendlines;
- Remove Trendlines;
- Use Trendline Forecasting;
- Identify Other Trend Methods;
- Add Sparklines;
- Remove Sparklines.
Dual Axes and Chart Templates
- Add a Second Chart Axis;
- Change Marker Colours;
- Save Chart Templates;
- Apply Chart Templates
- Apply Templates to Existing Charts
PivotTables, PivotCharts and Slicers - PivotTables
- Create PivotTables;
- Set the Layout for PivotTables;
- Group PivotTable Data;
- Arrange PivotTables;
- Add Calculated Fields;
- Remove Calculated Fields;
- Use GETPIVOTDATA.
Cubes and PivotTables
- Use Cube Functions;
- Update PivotTable Data;
- Display PivotTable Records;
- Show Report Filter Pages;
- Customise Fields;
- Hide Field Headers;
- Use PivotTable Report Options;
- Format PivotTables.
PivotCharts
- Create PivotCharts;
- Apply Filters to PivotCharts;
- Remove Filters;
- Switch PivotChart Axes;
- Use Quick Layout;
- Apply Chart Styles;
- Format PivotChart Objects;
- Change the Chart Type.
Slicers
- Understand Slicers;
- Add Slicers;
- Set Slicer Options;
- Apply Filters on Slicers;
- Clear Filters;
- Share Slicers;
- Connect Slicers.
Data Analysis Tools - Data Analysis Tools
- Name Variable Cells;
- Create Scenarios;
- Select Scenario Variables;
- Delete Scenarios;
- Edit Scenarios;
- Create Summary Reports;
- Use Data Tables;
- Use Goal Seek.